
Does market concentration matter?
Tuesday 17 October, 2023
Does market concentration matter?
Year to date performance of the US stock market
The S&P 500, the index which tracks the top largest 500 US companies, is up 14.2% year-to-date[1] in local currency terms. This is a satisfying return at first glance given the challenging environment companies have been operating in over the last few years. However, a quick glance under the bonnet shows just how unrepresentative this performance is for wider stock investing.
It’s been well documented that the so-called “Magnificent Seven” --Apple, Nvidia, Microsoft, Amazon, Tesla, Meta, and Alphabet-- have driven the S&P’s return this year. They are benefactors of the bullish sentiment around Artificial Intelligence (AI) and have been largely unaffected by rising inflation, geopolitical events, and higher cost of capital. The remaining 493 companies however have not experienced the safe euphoric price returns.
The tech giants’ share prices have moved aggressively this year on AI hopes, and its potential to boost productivity, efficiency, and the speed of services. Crucially, however, we must not forget that we are at the beginning of the journey. It will likely take years, if not decades, for AI’s power, capabilities and reach to fully take effect. This raises questions over whether the expected earnings growth from AI will actually materialise and if current valuations are justified.
Looking under the bonnet
Taking a closer look at the S&P 500’s performance this year reveals powerful and incredibly useful information for investors to consider. The concentration of the top performers has been dramatic and a large headwind to actively managed portfolios, which focus on spreading risk through diversification. As illustrated in the table below, to the end of September of this year, the top ten stocks in the S&P 500 have accounted for 96.5% of the index’s return. This truly is unprecedented when compared to historic contribution levels of the top ten in previous positive years.
[1] S&P 500, GBP Total Return, 31/12/2022 to 16/10/2023. Source: Morningstar
It will not be news to investors that a very small number of companies have driven the S&P 500’s returns this year. But what investors may not know is how genuinely unusual and unprecedented the concentration in the rally has been, and the impact this has to investment portfolios, particularly portfolios built with diversification and the downside protection of clients at the core.
Annual S&P 500 contribution of ten largest weights during positive performance years
|
Year |
Top 10 as % of total |
S&P 500 % performance |
|
2023 Year-to-Date |
96.5% |
11.7% |
|
2007 |
78.7% |
3.5% |
|
2020 |
58.9% |
16.3% |
|
1999 |
54.5% |
19.5% |
|
2021 |
45.0% |
26.9% |
|
1998 |
36.8% |
26.7% |
|
2017 |
33.3% |
20.3% |
|
2019 |
32.8% |
28.9% |
|
1991 |
28.6% |
26.3% |
|
2006 |
27.6% |
13.6% |
|
2016 |
26.6% |
9.5% |
|
2003 |
23.6% |
26.4% |
|
1995 |
22.3% |
34.1% |
|
2014 |
22.2% |
11.4% |
|
2004 |
21.1% |
9.0% |
|
2005 |
20.5% |
3.0% |
|
2010 |
19.6% |
12.8% |
|
2012 |
19.2% |
13.4% |
|
1997 |
19.1% |
31.0% |
|
2013 |
17.6% |
29.6% |
|
2009 |
15.5% |
23.5% |
|
1992 |
14.9% |
4.5% |
|
1993 |
12.2% |
7.1% |
Source: Factset
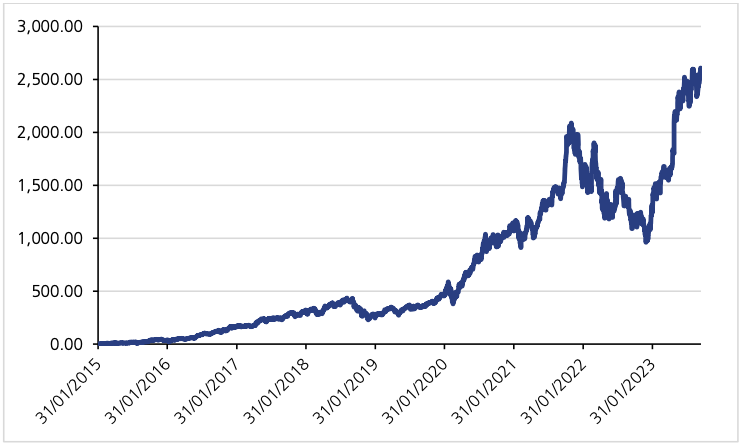
The S&P 500 is now the most concentrated it has been since the 1970s. Some caution this overvaluation and speculative behaviour will create another asset bubble like the tech bubble in the early 2000s. To contextualise the size of these tech giants leading the performance table, Apple is now worth more than the UK’s top 100 listed companies put together and the entire Russell 2000 (US smaller companies)[2]. Nvidia has gained $640bn in market capitalisation this year, almost the size of JP Morgan and Bank of America, the two biggest American banks, combined. The stock now trades on a PE ratio of 111[3].
The larger the company, the more it will contribute to the overall index return. And importantly, the lower the contribution from other, smaller companies. If we remove the impact of size and equally weight all 500 companies in the S&P, the return of the index is in fact negative this year in sterling terms and flat in local currency.
Year to date cumulative return (%) of “Magnificent Seven”, S&P 500 and S&P Equal Weighted Index
[2] The seven companies driving the US stock market rally, Financial Times, June 15th 2023
[3] Nvidia share price, USD P/E (LTM) as at 17/10/2023. Source: Factset
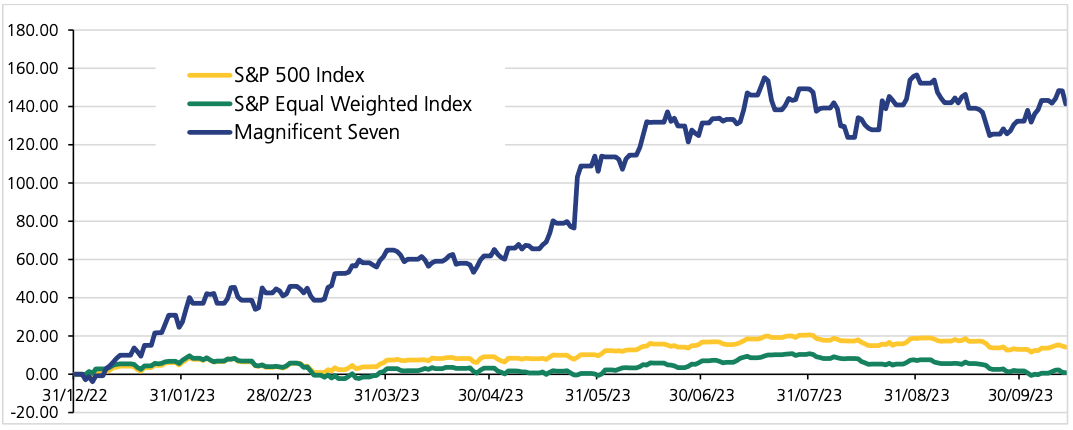
Source: Morningstar
The significance of the “Magnificent Seven” this year has been profound. For portfolios who have not held, or been underweight these stocks, it has been impossible to keep up. This was a very different story for these stocks last year. If we take the “Magnificent Seven” equally weighted, they went through a 50% decline in 2022. A not so rosy picture, and the crux of why diversification is so crucial in portfolios.
Source: Morningstar
Historically, the market tends to self-correct, as evidenced last year. Whilst we don’t know when a correction may be, or to what degree, what we do know is that we are comfortable being underweight some of these richly valued names if it means we defend and protect clients’ assets should the market mean revert.
Diversification can look dilutive over short and unusual time periods (like this year) but can be a saviour in other periods, which is why we always advocate a spread of carefully chosen and monitored exposures across asset classes, market sectors and geographies. This can be challenging to remember when very small parts of the market are running away, but it’s at these times when diversification is more important than ever.
We can consider diversification within portfolio construction through the same lens as our wardrobes. With the autumn chill having arrived this weekend, the trench coat you’ve had taking up space in your wardrobe will have felt unnecessary up until now. Just as the change in the season has arrived without warning, the tides can turn just as quickly in markets, and investors will be thankful for that trench coat hanging in their wardrobe to assist with weathering the storm.
Important information
Risk warning
This communication is issued and approved by Lonsdale Services Ltd. It is based on its understanding of events at the time of the relevant preparation and analysis. The information and opinions contained in this document are provided by Lonsdale and are subject to change without notice and should not be relied upon when making investment decisions. The value of your investments and the income from them may go down as well as up and neither is guaranteed. Investors could get back less than they invested. Past performance is not a reliable indicatorof future results.
Changes in exchange rates may have an adverse effect on the value of an investment. Changes in interest rates may also impact the value of fixed income investments.
The value of your investment may beimpacted if the issuers of underlying fixed income holdings default,
or market perceptions of their credit risk change.There are additional risks associated with investments in emerging or developing markets. The information in this document does not constitute advice, nor a recommendation, and investment decisions should not be made on the basis of it. The material provided should not be released or otherwise disclosed to any third party without prior consent from Lonsdale.


